
Effective Kubernetes cluster monitoring simplifies containerized workload management by measuring uptime, resource use (such as memory, CPU, and storage), and interaction between cluster components. It also enables cluster managers to monitor the cluster and discover issues such as inadequate resources, errors, pods that fail to start, and nodes that cannot join the cluster. Essentially, Kubernetes monitoring enables you to discover issues and manage Kubernetes clusters more proactively.
What Kubernetes Metrics Should You Measure?
Monitoring Kubernetes metrics is critical for ensuring the reliability, performance, and efficiency of applications in a Kubernetes cluster. Because Kubernetes constantly expands and maintains containers, measuring critical metrics allows you to spot issues early on, optimize resource allocation, and preserve overall system integrity. Several factors are critical to watch with Kubernetes:
- Cluster monitoring – Monitors the health of the whole Kubernetes cluster. It helps you find out how many apps are running on a node, if it is performing efficiently and at the right capacity, and how much resource the cluster requires overall.
- Pod monitoring – Tracks issues impacting individual pods, including resource use, application metrics, and pod replication or auto scaling metrics.
- Ingress metrics – Monitoring ingress traffic can help in discovering and managing a variety of issues. Using controller-specific methods, ingress controllers can be set up to track network traffic information and workload health.
- Persistent storage – Monitoring volume health allows Kubernetes to implement CSI. You can also use the external health monitor controller to track node failures.
- Control plane metrics – With control plane metrics we can track and visualize cluster performance while troubleshooting by keeping an eye on schedulers, controllers, and API servers.
- Node metrics – Keeping an eye on each Kubernetes node’s CPU and memory usage might help ensure that they never run out. A running node’s status can be defined by a number of conditions, such as Ready, MemoryPressure, DiskPressure, OutOfDisk, and NetworkUnavailable.
Monitoring and Troubleshooting Kubernetes Clusters Using the Kubernetes Dashboard
The Kubernetes dashboard is a web-based user interface for Kubernetes. It allows you to deploy containerized apps to a Kubernetes cluster, see an overview of the applications operating on the cluster, and manage cluster resources. Additionally, it enables you to:
- Debug containerized applications by examining data on the health of your Kubernetes cluster’s resources, as well as any anomalies that have occurred.
- Create and modify individual Kubernetes resources, including deployments, jobs, DaemonSets, and StatefulSets.
- Have direct control over your Kubernetes environment using the Kubernetes dashboard.
The Kubernetes dashboard is built into Kubernetes by default and can be installed and viewed from the Kubernetes master node. Once deployed, you can visit the dashboard via a web browser to examine extensive information about your Kubernetes cluster and conduct different operations like scaling deployments, establishing new resources, and updating application configurations.
Kubernetes Dashboard Essential Features
Kubernetes Dashboard comes with some essential features that help manage and monitor your Kubernetes clusters efficiently:
- Cluster overview: The dashboard displays information about your Kubernetes cluster, including the number of nodes, pods, and services, as well as the current CPU and memory use.
- Resource management: The dashboard allows you to manage Kubernetes resources, including deployments, services, and pods. You can add, update, and delete resources while also seeing extensive information about them.
- Application monitoring: The dashboard allows you to monitor the status and performance of Kubernetes-based apps. You may see logs and stats, fix issues, and set alarms.
- Customizable views: The dashboard allows you to create and preserve bespoke dashboards with the metrics and information that are most essential to you.
Kubernetes Monitoring Best Practices
Here are some recommended practices to help you properly monitor and debug Kubernetes installations:
1. Monitor Kubernetes Metrics
Kubernetes microservices require understanding granular resource data like memory, CPU, and load. However, these metrics may be complex and challenging to leverage. API indicators such as request rate, call error, and latency are the most effective KPIs for identifying service faults. These metrics can immediately identify degradations in a microservices application’s components.
2. Ensure Monitoring Systems Have Enough Data Retention
Having scalable monitoring solutions helps you to efficiently monitor your Kubernetes cluster as it grows and evolves over time. As your Kubernetes cluster expands, so will the quantity of data it creates, and your monitoring systems must be capable of handling this rise. If your systems are not scalable, they may get overwhelmed by the volume of data and be unable to offer accurate or relevant results.
3. Integrate Monitoring Systems Into Your CI/CD Pipeline
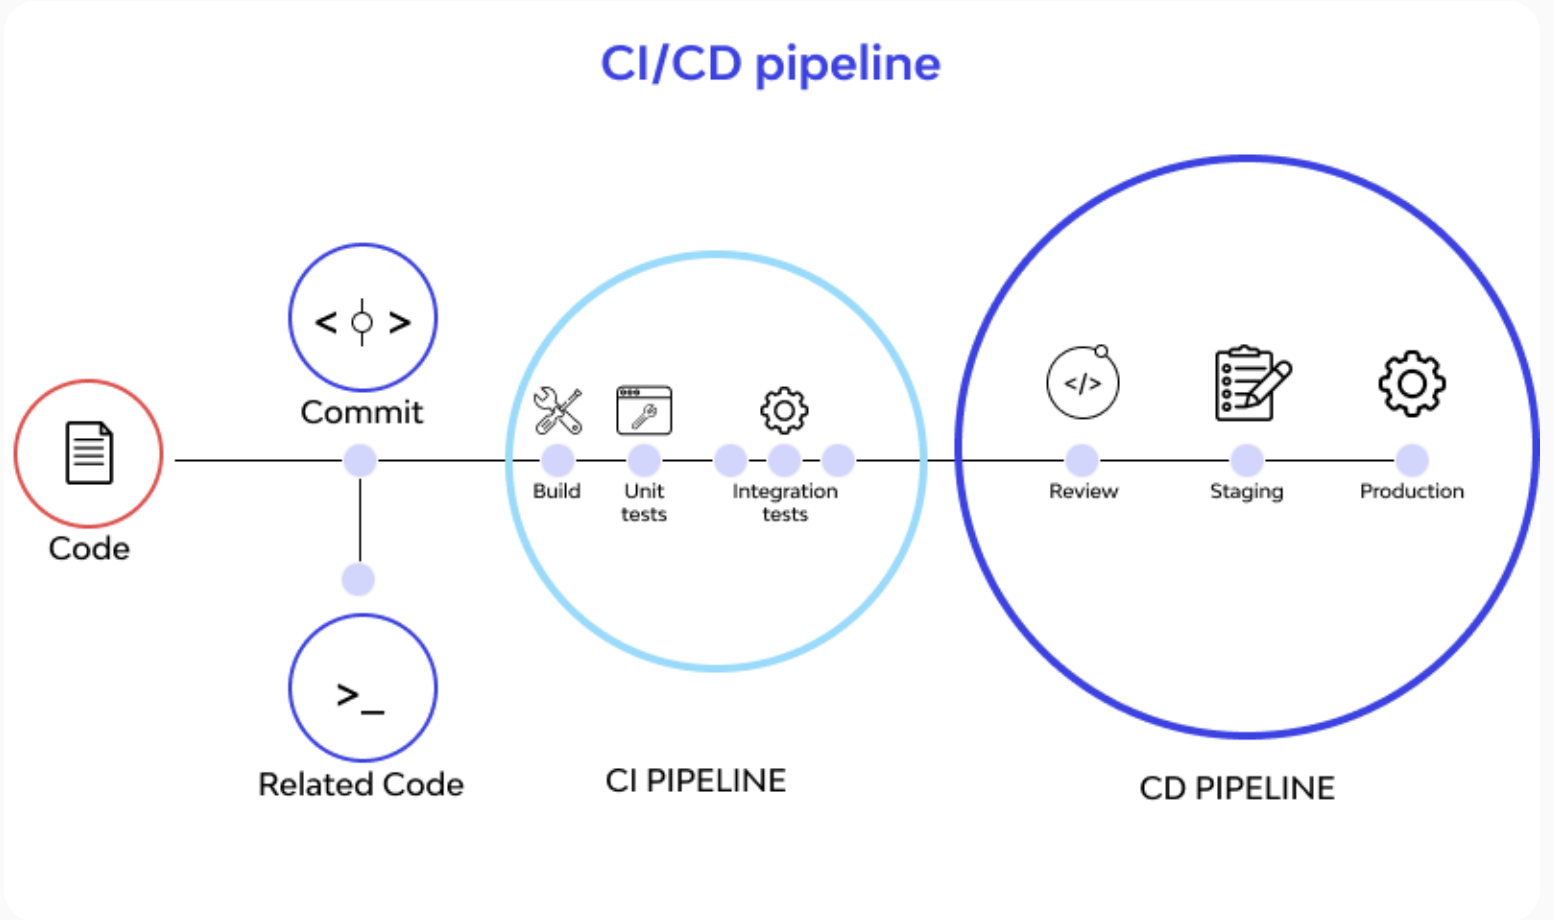
Integrating Kubernetes monitoring solutions with CI/CD pipelines enables you to monitor your apps and infrastructure as they are deployed, rather than afterward. By connecting your monitoring systems to your pipeline for continuous integration and delivery (CI/CD), you can automatically collect and process data from your infrastructure and applications as it is delivered. This enables you to identify potential issues early on and take action to stop them from getting worse.
4. Create Alerts
You may identify the problems with your Kubernetes cluster early on and take action to fix them before they get worse by setting up the right alerts. For example, if you configure alerts for crucial metrics like CPU or memory use, you will be informed when those metrics hit specific thresholds, allowing you to take action before your cluster gets overwhelmed.
Conclusion
Kubernetes allows for the deployment of a large number of containerized applications within its clusters, each of which has nodes that manage the containers. Efficient observability across various machines and components is critical for successful Kubernetes container orchestration. Kubernetes has built-in monitoring facilities for its control plane, but they may not be sufficient for thorough analysis and granular insight into application workloads, event logging, and other microservice metrics within Kubernetes clusters.